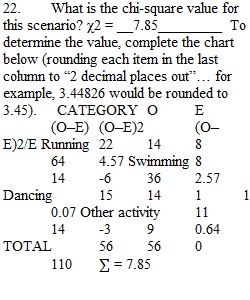
Q Psychology Statistics Dr. Robin Akawi Spring 2022 STATS PACK 3: WEEK 13 “Relationships and Expectations” Worksheets included: Concepts Page Length WEEK 10 Tech Practice 3 WEEK 11 Pearson Correlation 3 Intro to Regression Analyses (i.e., Prediction) 2 WEEK 12 Exam 2 WEEK 13 Intro to Chi Square 5 Statistical Software Outputs (Excel, Vassarstats) Open Statistical Software Outputs (SPSS if available) Open Chi Square “Just What I Expected!’ For this activity you will complete two chi-square scenarios. One is for Goodness of Fit, the other is for Independence. All formulas and the table needed are below. Have fun! ? Formulas and table for the scenarios: A lot of our scenarios before were based on reducing anxiety/stress. Have you heard that exercise helps for that too? But how many people actually exercise and what kinds do they do? Let’s consider some common ones… Running Swimming Dancing Other GOODNESS OF FIT scenario based on Null. A psychologist was interested in students’ stress-reduction strategies. Of the 56 students surveyed, 22 preferred running, 8 preferred swimming, 15 preferred dancing, and 11 preferred some other activity. Using the .05 significance level, do the results suggest that people prefer different stress-reduction strategies in general? Assume the null hypothesis is that there will be no differences between the four strategies. 1. Construct the table with the data reported above, including the expected frequency noted below each observed frequency. Put the expected value in parentheses. Since we are not saying which activity we think is expected more, and we have four categories, 100% of the frequency seen can be divided by 4. This means we give an expected score that is 25% of the total frequency. Thus, “total frequency x .25 = ____”. This is based on the “null hypothesis” that states we can expect to see the same frequency in all category frequencies. 22 ( ) 8 ( ) 15 ( ) 11 ( ) Total f = 2. What is the chi-square value for this scenario? ?2 = __________ To determine the value, complete the chart below (rounding each item in the last column to “2 decimal places out”… for example, 3.44826 would be rounded to 3.45). CATEGORY O E (O–E) (O–E)2 (O–E)2/E Running 22 Swimming 8 Dancing 15 Other activity 11 TOTAL ? = 3. What is the df for this scenario? C – 1 = 4. What is the critical value? ?2 needed (df =____, a = .05) = 5. Can we reject the null hypothesis? Why or why not? And what does this mean? 6. Note how this would be reported in a journal for just the statistic part by completing the following using this hint ?2 (df, n = ?) = ????, p ___ .05 ?2 (___, n =___) = _______, p ___ .05? GOODNESS OF FIT scenario based on “known proportion”. A psychologist was interested in students’ stress-reduction strategies. Of the 60 students surveyed, 20 preferred running, 12 preferred swimming, 18 preferred dancing, and 10 preferred some other activity. Using the .05 significance level, do the results suggest that people prefer different stress-reduction strategies in general? Assume we know the population values and use those proportions to determine the expected frequency of each category. 7. Construct the table with the data reported above, including the expected frequency noted below each observed frequency. Put the expected value in parentheses. For this, we DO know the proportion in the full population. Running tends to be 40%, Swimming at 15%, Dancing is 20%, Other is 25%. This means we give an expected score that is our total frequency multiplied by its expected proportion. For example, if our total frequency is 80 and the percentage expected to be in one category is 30% then we calculate 80 x .30 = 24 as the expected frequency for that category. Running Swimming Dancing Other Activity 20 ( ) 12 ( ) 18 ( ) 10 ( ) Total f = 8. What is the chi-square value for this scenario? ?2 =__________ To determine the value, complete the chart below (rounding each item in the last column to “2 decimal places out”… for example, 3.44826 would be rounded to 3.45). CATEGORY O E (O–E) (O–E)2 (O–E)2/E Running 20 Swimming 12 Dancing 18 Other activity 10 TOTAL ? = 9. What is the df for this scenario? C – 1 = 10. What is the critical value? ?2 needed (df = ____, a = .05) = 11. Can we reject the null hypothesis? Why or why not? And what does this mean? . 12. Note how this would be reported in a journal for just the statistic part by completing the following using this hint ?2 (df, n = ?) = ????, p ___ .05 ?2 (___, n =___) = _______, p ___ .05? INDEPENDENCE scenario. A Psychologist noted that other than exercising, it was also important to have “down time”, such as watching movies. The question was what number of movies are typically watched, and how much that might differ between high-stress and low-stress students. High-Stress students watched 10 comedies, 15 romances, 10 musicals, 15 dramas, and 10 news shows. Low Stress students watched 6 comedies, 5 romances, 10 musicals, 10 dramas, and 9 news shows. Using a = .05 significance level, is the distribution of type of shows watched different for students with high stress levels and low stress students? 13. Create the contingency table and do all needed calculations to get the expected frequency values. Be sure to label the table carefully. Comedy Romance Musical Drama News TOTAL & % High Stress 10 (9.6) Low Stress 6 (6.4) TOTAL Calculate for each cell the “total row frequency divided by the overall total frequency” and multiply by the total column frequency. For example, your first one from each row is given. Do these calculation steps for all cells. (60/100)16 (40/100)16 Finish calculating the expected frequency that goes in each cell in parentheses next to the observed frequency in each. You’ll do this by carrying out the calculations for each equation above. The first two expected frequencies are given. (0.6)16=9.6 (0.4)16=6.4 14. What is the chi-square value for this scenario? (Round calculations to 2 decimal points as you go.) The first calculation is given. Add the rest of the calculations, then carry them out until you end with your ?2 value. ___________ 15. What is the df for this scenario? ____________ 16. What is the critical value? ____________ 17. Can we reject the null hypothesis? Why or why not? NO, because our obtained values OVERALL are NOT more extreme than the critical value. 18. Based on the results, which one do you see as being the “most surprising” that you would want to look more into as a researcher, and why? For example, what category of show surprised you based on high and low stressed individuals watching them, and why do you think that difference was there? 19. How would you write the results for a research publication? 20. A critical thinking question: Think back to the Factorial ANOVA we did that looked similar to the Chi Square of Independence that we just did. Compare and contrast the two. Respond to two of the three items below: a. What was similar between the two? b. What was difference between the two? c. How would you do this Chi Square scenario as a Factorial ANOVA? ? Statistics Program Practice Scenarios “Technology is Fun!” ? The space below is for you to go back through the work you have done in all the stats packs so far and use the data provided on the worksheets to practice using statistical programs (such as Vassarstats, and/or Excel/Google-Sheets). You can do as many as you’d like, but should do no less than two types of statistics. This should be different than what you did for the Week 10 submission. It is highly suggested that you run it in at least two of the programs. For example, if you do an “independent t-Test” in Excel, you should also run it in Vassarstats and compare the results (called “output”) to see which values each program provides. Do a screenshot that includes the entire output (can be done in one screenshot or a few depending on how long it is). For each pasted “output” please list the following three items and paste the image that goes with it directly under the three items. 1. Which Stats Pack were you working on while generating this output? 1 2 or 3 2. Which analysis was it… example, “t-Test independent” or “Pearson Correlation”, etc. 3. Which item number from that worksheet is being illustrated in the output? I ask that you please keep them in the order we covered them throughout the semester. ? It will allow for more timely feedback if needed. You can also add additional sheets as needed.
View Related Questions